| ECE 381: Laboratory 9 | |
| Discrete-time system response by recursion | |
|
| |
|
| |
Consider a discrete-time system described by a general, N-th order, linear constant-coefficient difference equation
and initial stateA0 y[n] + A1 y[n-1] + ··· + AN y[n-N] = B0 x[n] + B1 x[n-1] + ··· + BM x[n-M]
By calling dtsim with three output arguments, you can get the zero-state and zero-input responses, YZS and YZI, in addition to the total response YN, all computed over the same index range as the input XN. If you omit the input argument IC, the system is assumed to be in relaxed state initially. The following commented examples illustrate such different uses of dtsim:YN = dtsim(B,A,XN,IC);
YZS = dtsim(B,A,XN,zeros(1,N));   % zero-state response
YZS = dtsim(B,A,XN);              % zero-state response
YZI = dtsim(B,A,zeros(1,K),IC);   % zero-input response for 0 ≤ n < K
YN = YZS + YZI;                   % total response
[YN,YZS,YZI] = dtsim(B,A,XN,IC);  % most general call (all three responses
                                  % in one shot)
HN = dtsim(B,A,[1 zeros(1,K-1)]); % impulse response to K terms
An alternative way for obtaining the impulse response
HN = dtsim(B,A,K);
Before doing an example, there is one quirk of dtsim that needs to
be noted: it requires the coefficient vectors A and B to be of
the same length. The general form of the diffence equation given above assumes
that the leading output and input terms are
y[n] = x[n-2] ···> A = 1;
A = [1 0 0];B = [0 0 1];
B = [0 0 1];y[n] = x[n+1] ···> A = [0 1];
A = [0 1];B = 1;
B = [1 0];y[n] - 2y[n-1] = x[n+1] + 2x[n] - x[n-2] ···> A = [0 1 -2];
A = [0 1 -2 0];B = [1 2 0 -1];
B = [1 2 0 -1];
Now, take the following example:
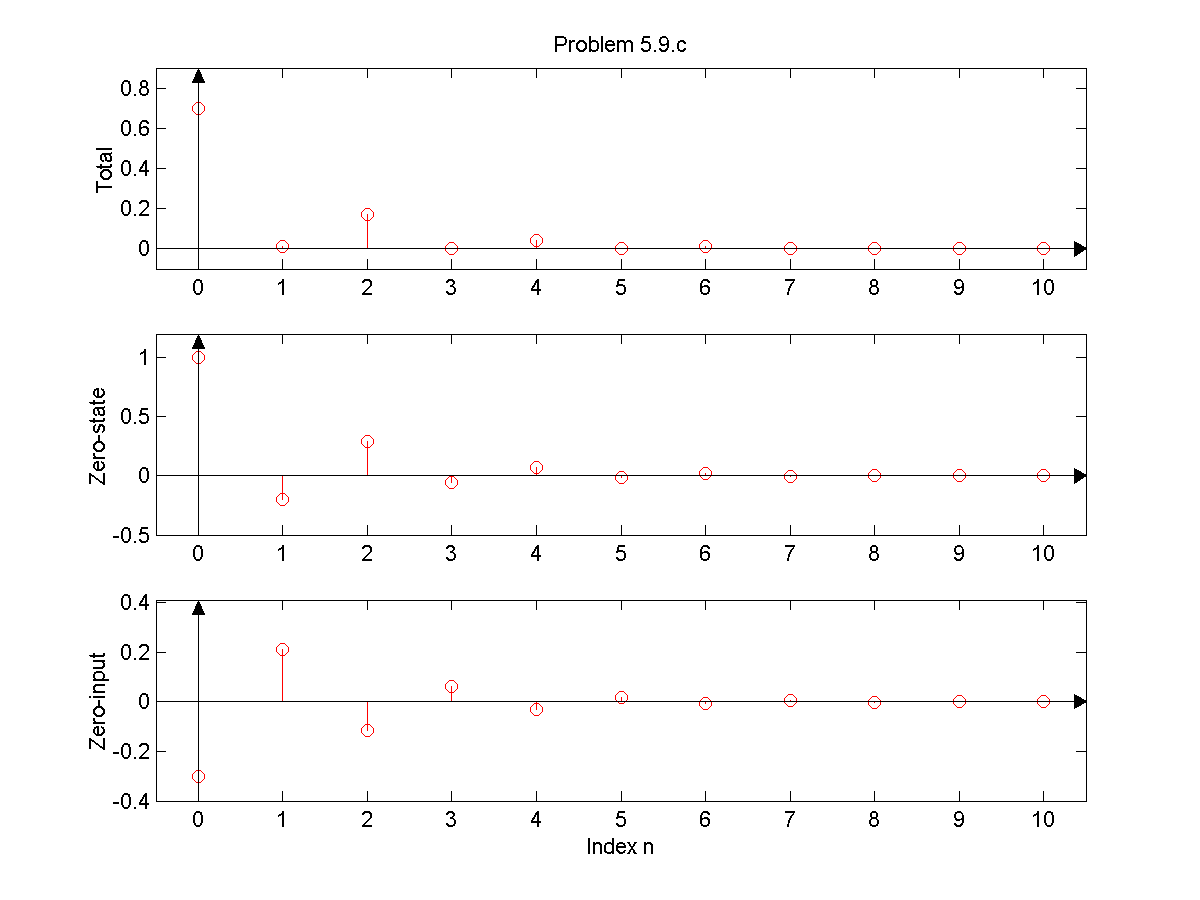
y[n] + 0.7y[n-1] + 0.1y[n-2] = x[n]; x[n] = (0.5)n u[n]; y[-1] = 0, y[-2] = 3. >> n = 0:10; x = 0.5 .^ n; >> [yt,yzs,yzi] = dtsim([1 0 0],[1 .7 .1],x,[0 3]); >> figure(1); clf; >> subplot(3,1,1); >> dtplot(n,yt,'o'); ylabel('Total'); >> axis([-.5 10.5 -.1 .9]); axesn; >> title('Problem 5.9.c'); >> subplot(3,1,2); >> dtplot(n,yzs,'o'); ylabel('Zero-state'); >> axis([-.5 10.5 -.5 1.2]); axesn; >> subplot(3,1,3); >> dtplot(n,yzi,'o'); ylabel('Zero-input'); >> axis([-.5 10.5 -.4 .41]); axesn; >> xlabel('Index n');
Also see the example below. Its about smoothing effects of a moving average filter. Exercise 4 in this assignment is about minimizing such undesired variations superimposed on a signal due to random noise. Filtering in general is a commonly used technique to minimize noise effects, and a moving average filter is probably the simplest form of filtering that could be used for this purpose. In Exercise 4, you will try out different forms of filtering for noise suppression.
Consider a 20 point moving average FIR filter y[n]=1/20{x[n]+x[n-1]+.....+x[n-19]}. It is also called a smoothing filter because it tends to smooth out the rapid variations in a signal. To confirm its smoothing property, try the following:
n=0:199;
x=sin(2*pi*n*0.025); x=x(:);
xn=x+0.5*randist(x,'uni');
a=[1 zeros(1,19)];
b=0.05*ones(1,20);
y=filter(b,a,xn);
plot(n,x);
plot(n,xn,n,y);
| School of Computing and Engineering University of Missouri - Kansas City |
Last updated: March 27, 2006 |